Energy Dashboard and guide
DTU Energy Dashboard allows you to keep track of your department or unit's energy prices, consumption and C02 emissions. In this way, you can, for example, plan when it is most economical or environmentally friendly to start the laboratory machine, autoclave or robot/dishwasher.
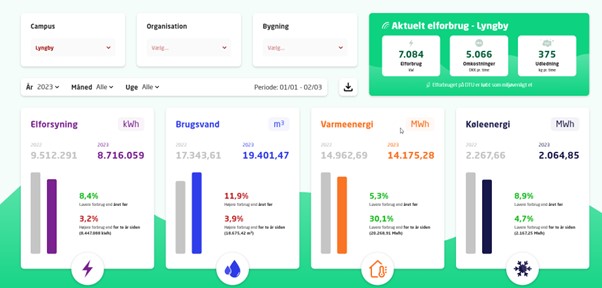
What and how
It is possible to see the electricity consumption for all campuses (Lyngby, Risø and Ballerup). It is also possible to sort whether data should be seen for a specific year, month, week and hourly basis as well as compare with previous years. You can read the numbers directly on the board or download them to form your own excel graph.
- View the DTU Energy Dashboard
- Download a guide here
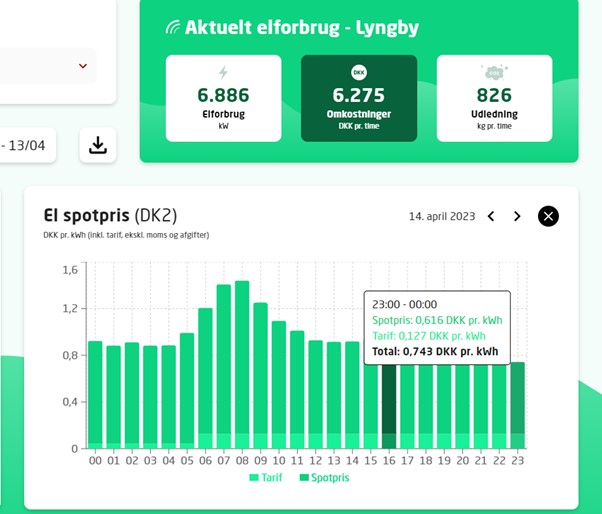
Energy "tip: Save 50% at night
Electrical appliances where the time of start-up is not decisive can advantageously be switched on when energy is cheap. The dashboard's function "Current electricity consumption" can thus help save money.
If it is CO2 emissions that need to be saved, it is also possible to plan accordingly. Fortunately, it is often the case that the cheapest prices (those that are traded on the spot market every day) often go hand in hand with the least CO2 emissions.
Campus Service estimates that by adjusting energy consumption to energy prices where possible, savings of up to 50% can be achieved.